Zazzle Shop

Screen printing
Showing posts with label Global Warming. Show all posts

Wednesday, August 19, 2009

Global Ocean Temperatures for July 2009 Break Records

by Jennifer Lance in Saving Water

According to the National Oceanic and Atmospheric Administration (NOAA), July 2009 was the hottest month on record for the average global ocean surface temperature. The previous record was broken in 1998. When combined with global land surface temperatures, July 2009 was the fifth warmest month since data collection began in 1880.

July 2009 ocean temperatures break records.

July 2009 ocean temperatures break records.

The New York Times describes NOAA’s briefing:

The agency said the average sea surface temperature was 1.06 degrees higher than the 20th-century average of 61.5 degrees. Though July was unusually cool in some areas, like the eastern United States, analysts at the NOAA Climate Data Center said the combined global land and ocean surface temperature was 1.03 degrees higher than the 20th-century average of 60.4 degrees, the fifth warmest since worldwide record keeping began in 1880.

Specifically, NOAA reports the “Notable Developments and Events” responsible for the increased warming:

  • El Niño persisted across the equatorial Pacific Ocean during July 2009. Related sea-surface temperature (SST) anomalies increased for the sixth consecutive month.
  • Arctic sea ice covered an average of 3.4 million square miles during July. This is 12.7 percent below the 1979-2000 average extent and the third lowest July sea ice extent on record, behind 2007 and 2006. Antarctic sea ice extent in July was 1.5 percent above the 1979-2000 average. July Arctic sea ice extent has decreased by 6.1 percent per decade since 1979, while July Antarctic sea ice extent has increased by 0.8 percent per decade over the same period.
  • Cooler-than-average conditions prevailed across southern South America, central Canada, the eastern United States, and parts of western and eastern Asia. The most notably cool conditions occurred across the eastern U.S., central Canada, and southern South America where region-wide temperatures were nearly 4-7 degrees F (2-4 degrees C) below average.
  • Large portions of many continents had substantially warmer-than-average temperatures during July 2009. The greatest departures from the long-term average were evident in Europe, northern Africa, and much of western North America. Broadly, across these regions, temperatures were about 4-7 degrees F (2-4 degrees C) above average.

Some scientists suspect a link between global warming and El Niño. Kevin Trenberth, a National Center for Atmospheric Research climatologist, believes that during periods of global warming, the “ocean currents and weather systems might not be able to bleed off all the heat pumped into the tropical seas.” Under such a scenario, El Niño acts as a “pressure release valve” for this excess heat.

All of the “Notable Developments and Events” could all be attributed to climate change.

Monday, August 17, 2009

Hong Kong's Air Pollution Problem (PIC)

ChinaAirPollution-001
click to enlarge

20070917AHKG02 HONG KONG CHINA : (COMPOSITE) A composite photo showing two views of the Hong Kong skyline taken from the same viewpoint in Tsim Sha Tsui district of Kowloon; the top image taken at 6pm on 20 June 2007, when Hong Kong`s `Air Pollution Index` reading was `Low`; the lower image taken at 6pm on 17 September 2007 when Hong Kong`s `Air Pollution Index` reached `High to Very High`, 17 September 2007, Hong Kong, China. A new study released Monday by Hong Kong think tank `Civic Exchange` stated that drastic action needs to be taken to reduce air pollution in the city to attract and retain foreign investment, as well as protect public health.

Thursday, January 22, 2009

Summer peak, winter low temperatures now arrive 2 days earlier

Not only has the average global temperature increased in the past 50 years, but the hottest day of the year has shifted nearly two days earlier, according to a new study by scientists from the University of California, Berkeley, and Harvard University.
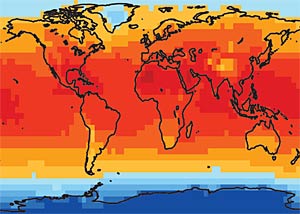
July
Map of average distribution of global temperatures for JulyFebuary
Map of average distribution of global temperatures for February
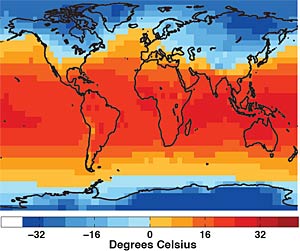
The average distribution of global temperatures for July and February. Because the sun is further north in July, the warm bulge of high temperatures is shifted into the northern hemisphere in that month. In the Northern Hemisphere, warm temperatures extend farther north on land than over ocean in the summer and cold temperatures extend farther south on land than on the ocean in the winter. (Image by Alexander R. Stine/UC Berkeley; data from the Climate Research Unit at the University of East Anglia )

Just as human-generated greenhouse gases appear to the be the cause of global warming, human activity may also be the cause of the shift in the cycle of seasons, according to Alexander R. Stine, a graduate student in UC Berkeley's Department of Earth and Planetary Science and first author of the report.

"We see 100 years where there is a very natural pattern of variability, and then we see a large departure from that pattern at the same time as global mean temperatures start increasing, which makes us suspect that there's a human role here," he said.

Although the cause of this seasonal shift - which has occurred over land, but not the ocean - is unclear, the researchers say the shift appears to be related, in part, to a particular pattern of winds that also has been changing over the same time period. This pattern of atmospheric circulation, known as the Northern Annular Mode, is the most important wind pattern for controlling why one winter in the Northern Hemisphere is different from another. The researchers found that the mode also is important in controlling the arrival of the seasons each year.

Whatever the cause, Stine said, current Intergovernmental Panel on Climate Change (IPCC) models do not predict this phase shift in the annual temperature cycle.

Details are published in the Jan. 22 issue of the journal Nature.

Temperatures at any given time of the year can be very different on land than over the ocean, Stine said, and a change in the strength and direction of the winds can move a lot of heat from the ocean onto land, which may affect the timing of the seasons. However, this seems to be only a partial explanation, he said, because the relationship between this pattern of circulation and the shift in the timing of the seasons is not strong enough to explain the magnitude of the seasonal shift.

The researchers also found that the difference between summer and winter land temperatures has decreased over the same 50-year period, with winter temperatures warming more than those in summer. They found that in non-tropical regions, winter temperatures over land warmed by 1.8 degrees Celsius and summer temperatures increased by 1 degree. Ocean warming has been somewhat less.

Stine noted that the study limited its focus to non-tropical regions because the seasons are more pronounced outside the tropics.

July
images of the Earth's land surface for July 2002February
images of the Earth's land surface for February 2002Composite images of the Earth's land surface for July and Feb 2002 made as part of NASA's Blue Earth project. (NASA images by Reto Stöckli)

Stine, Peter Huybers, assistant professor of earth and planetary sciences at Harvard University, and Inez Fung, UC Berkeley professor of earth and planetary science and of environmental science, policy and management, and co-director of the Berkeley Institute of the Environment, based their study on a publicly available database of global surface temperature measurements over both land and ocean from 1850 to 2007 that was compiled by the University of East Anglia's Climate Research Unit in the United Kingdom. Using non-tropical data only, the team found that, while land temperatures in the 100-year period between 1850 and 1950 showed a simple pattern of variability, with the hottest day of the year in the Northern Hemisphere around July 21, temperatures in the period 1954-2007 peaked 1.7 days earlier.

Stine said that monthly temperatures follow a sinusoidal curve, rising to a peak in mid-summer, then dropping to a winter low, and finally rising again because of increased sunshine to another summer high. The temperature typically lags solar insolation by about 30 days over land and 60 days over the ocean, he said, because it takes less energy to heat the moisture in soil than to heat the ocean.

Biologists have noticed large changes in the arrival time of many signs of spring over the past 50 years. Buds have been seen opening earlier, birds migrating earlier, snow melting earlier and sea ice breaking up earlier. These changes have been explained by the fact that the Earth is warming, and thus the temperature in any given month has increased. In contrast, this new study finds that individual months have been warming at different rates than others, and that as a result, the peak summer temperature and lowest winter temperature both now come earlier in the calendar year.

"We're saying that, on top of the long term trend of warmer summer and winter highs, peak warming is coming earlier within the year," Fung said. "It's not just the onset of spring, but the peak."

The research team is now looking for other mechanisms to explain the observed shift in the timing of the seasons. These include a hypothesized drying of the global soils, which would cause the land surface to respond more quickly to the sun, and changes in the amount of solar energy absorbed by the atmosphere due to industrial pollution.

One surprising aspect of the researchers' findings is that the changes they discuss explain so much about the changes over the last 50 years in the month-to-month pattern of temperatures around the globe.

"Once we have accounted for the fact that the temperature averaged over any given year is increasing, we find that some months have been warming more than other months. We were surprised to find that over land, most of the difference in the warming of one month relative to another is simply the result of this shift in the timing of the seasons, and a decrease in the difference between summer and winter temperatures," said Stine.

"The difference between summer and winter temperatures is comparable to the difference between ice age temperatures and non-ice age temperatures over much of the planet," Stine said. "Thus, small changes in the annual cycle can produce a big effect even if they do not change the annual mean temperature."

The research was funded by the National Science Foundation.

Monday, December 22, 2008

Methane Bubbling Up From Undersea Permafrost?


From June 15 (top) to July 27 (bottom), sea ice in the East Siberian Sea declined by as much as 81,081 square miles (210,000 square kilometers) a day, a rapid dip attributed to global warming.

The sea is also bubbling with methane, a powerful greenhouse gas, being released from underwater reserves, a Russian team announced during a December 2008 meeting.

The discovery could be a sign that global warming is thawing underwater permafrost, which is releasing methane that has been locked away for many thousands of years.

Images courtesy NASA

Mason Inman in San Francisco, California
for National Geographic News
December 19, 2008 The East Siberian Sea is bubbling with methane, a powerful greenhouse gas, being released from underwater reserves, according to a recent expedition by a Russian team.

This could be a sign that global warming is thawing underwater permafrost, which is releasing methane that has been locked away for many thousands of years.

If these methane emissions from the Arctic speed up, it could cause "really serious climate consequences," said study leader Igor Semiletov of the Pacific Oceanological Institute in Vladivostok, Russia.

(Related: "Global Warming Feedback Loop Caused by Methane, Scientists Say" [August 29, 2006].)

Semiletov and colleagues have traveled along the Siberian coast—this year they covered 13,000 miles (22,000 kilometers)—while monitoring methane concentrations in the air and observing the seas.

"According to our data, more than 50 percent of the Arctic Siberian shelf is serving as a source of methane to the atmosphere," Semiletov said.

This vast shelf is about 750,000 square miles (2 million square kilometers)—about the same size as Greenland or Mexico—and about 80 percent of it is covered with permafrost, Semiletov said.

He presented the findings from his group at an American Geophysical Union meeting in San Francisco this week.

Not-So-Permanent Permafrost

Permafrost is basically dirt that's been permanently frozen for hundreds or thousands of years, much of it since the last ice age.

Sea levels back then near the Siberian coast were about 325 feet (100 meters) lower than today, and the exposed ground froze solid down to 1,600 to 2,300 feet (500 to 700 meters) deep.

Over the past 10,000 years, sea levels rose to cover some of this permafrost, and in recent years those seas have seen increases in average temperatures.

"As a result, sub-sea permafrost has warmed up to minus 1 degree Celsius [30 degrees Fahrenheit]," Semiletov said. "It's very, very close to the thawing point."

Underneath the permafrost are stores of methane, the same as the natural gas people use for cooking and heating.

There are also methane hydrates, a solid that forms when methane and water mix in cold temperatures. The hydrates release gas as they warm.

"It was assumed that these stores of methane have not been leaking, because the sub-sea permafrost served as a lid keeping hydrates and natural gas in place," Semiletov said.

But now global warming may be starting to release these stores of methane into the atmosphere.

Drastic Increase

Regions farther from the Equator generally are experiencing more warming, and the Arctic is warming fastest of all.

"Springtime air temperatures on the East Siberian Arctic shelf [have] increased up to 5 degrees Celsius [9 degrees Fahrenheit]," Semiletov said. "It's a hot spot."

In comparison, the world as a whole has warmed about 1.25 degrees Fahrenheit (0.7 degrees Celsius) since pre-industrial times.

If abrupt methane release became widespread, it could create a feedback loop that would lead to even more drastic global warming.

"Our early observations in 1994 to 1999 didn't reveal a widespread enhanced dissolved methane concentration" along the Siberian coast, Semiletov said.

"With this newly obtained data, we suggest an increase of methane release from the East Siberian Arctic shelf," he said.

"We have obtained a drastic increase of air methane in some sites—sometimes up to four times higher than the background [global average]."

Vladimir Romanovsky, a permafrost expert at the University of Alaska, Fairbanks, says the study is worrying.

"It has very serious implications for changes in greenhouse gases," Romanovsky said, and the releases described should be monitored more closely.

"It could be very important, but we still need some numbers to see how big [of a problem] it is."
© 1996-2008 National Geographic Society. All rights reserved.